We believe inflation and interest rate volatility are the primary “winners” following the passage of the $3.6 trillion One Big Beautiful Bill. Over the next decade, on an annualized basis, US debt is expected to grow 7.7 percent, US GDP will likely grow 0.5 percent (source: CBO), and debt/GDP is estimated to rise to 127% (source: Tax Foundation). Nobody seems to care about the national debt for now. Credit Default Swap (CDS) spreads on US Treasurys have declined 14 basis points in the past 2 months (source: Bloomberg).
RiskBridge expects 2026 inflation to reach 3.0-2.25%, creating potential constraints on the administration’s currency and interest rate policies. Rising inflation may further devalue the USD, making Treasurys less attractive to foreign buyers and pushing yields higher.
In the coming weeks, the Treasury will begin funding $5 trillion of new debt ceiling capacity with T-bills (not notes). In the long term, issuing T-bills to finance new and existing debt may be the last resort before the US is forced into some form of debt restructuring (i.e., a debt swap).
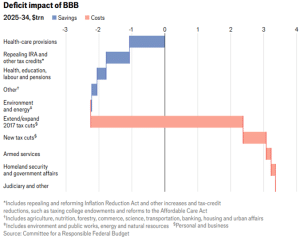
The chart below (source: The Economist) shows the deficit impact of the bill. The biggest impact comes from making the 2017 tax cuts permanent. Other breaks include tax breaks for tips and overtime, and raising federal tax relief for payment of state and local taxes.
While we expect volatility over the coming quarters, the U.S. economy should avoid a recession, given corporate profit growth is still positive y/y. Fiscal boosts are coming, especially for capex, and monetary policy is also expected to ease.
Past performance has no guarantee of future results. Personnel of RiskBridge Advisors, LLC (“RiskBridge”) prepared the Risk Report. The views expressed herein do not constitute research, investment advice, or trade recommendations. RiskBridge may, from time to time, participate or invest in transactions with issuers of securities that participate in the markets referred to herein, perform services for or solicit business from such issuers, and/or have a position or effect transactions in the securities or derivatives thereof.
All references to index funds and other economic indicators are provided for illustrative purposes only. Investors cannot invest in an index, and indexes do not reflect the deduction of advisor’s fees or other trading expenses.
Information about benchmark indices is provided to allow you to compare them to the performance of RiskBridge portfolios. Investors often use these well-known and widely recognized indices as one way to gauge the investment performance of an investment manager’s strategy compared to investment sectors that correspond to the strategy. However, RiskBridge’s investment strategies are actively managed and not intended to replicate the performance of the indices: the performance and volatility of RiskBridge’s investment strategies may differ materially from the performance and volatility of their benchmark indices, and their holdings will differ significantly from the securities that comprise the indices. You cannot invest directly in indices that do not take into account trading commissions and costs. Net total return indices reinvest dividends after the deduction of withholding taxes, using (for international indices) a tax rate applicable to non-resident institutional investors who do not benefit from double taxation treaties.
S&P 500® Index is a market capitalization-weighted index of 500 of the largest U.S. companies, designed to measure broad U.S. equity performance.
This Risk Report is distributed for informational purposes only. All material presented is compiled from sources believed to be reliable, but accuracy cannot be guaranteed, and RiskBridge makes no representation as to its accuracy or completeness. Any opinions, recommendations, and assumptions included in this material are based upon current market conditions, reflect the judgment of RiskBridge as of the date indicated, and are subject to change without notice. You acknowledge and agree that RiskBridge is not obligated to provide any additional information or update such information in making the information available. Securities and/or indices highlighted or discussed in this communication are mentioned for illustrative purposes only and should not be construed as investment recommendations. All investments involve risk, including the loss of principal. Before implementing any strategy, consult with a qualified financial adviser and/or tax professional. Risk Report and this information are not intended to provide investment, tax, or legal advice, and this material is not to be relied upon in substitution for the exercise of independent judgment. This Risk Report is not to be reproduced, in whole or part, without the written consent of RiskBridge.